

What is Alpha Diversity?
Alpha diversity describes how diverse the microbial community within a single sample is. It is often the first measure examined in a microbiome study, because changes in community diversity are frequently associated with health status, disease or treatment. To express diversity as a single number, the full profile of the sample (taxa, genes, pathways or functions) is condensed into one value. This requires a decision on what “diversity” means, and it can be defined in more than one way.- Richness counts how many different features (e.g: microbial species) are present in the sample.
- Evenness describes how equally the features share the total abundance.
- Combined definitions consider richness and evenness together.
Why is Alpha Diversity useful?
Alpha diversity is one of the most widely used analyses in a microbiome study, because it gives a compact overview of the community structure within each sample. Many biological and environmental factors influence microbial communities, for example disease, antibiotics, diet, age, treatment, host genetics and body site, and their effects are often reflected in alpha diversity. When groups of samples that differ in a variable of interest, such as health status or treatment, also show different alpha diversity distributions, this suggests that the variable is associated with differences in the overall microbiome. Alpha diversity is not a universal health score, and its interpretation depends strongly on the ecosystem and the biological system under study. In many ecosystems, higher diversity indicates a more complex and potentially more stable community with greater functional redundancy, that is, several taxa able to perform the same function. In a soil or gut microbiome, for example, other taxa can compensate for the loss of an individual species. In other ecosystems, low diversity is characteristic of a healthy, specialised community. The healthy vaginal microbiome is usually dominated by Lactobacillus, and an increase in diversity often signals dysbiosis, that is, an imbalance in the microbial community. Changes in alpha diversity, whether increases or decreases, therefore need to be interpreted relative to the specific habitat, host and perturbation, and should not be assumed to be good or bad on their own.How does alpha diversity work?
1
Start with a input feature table
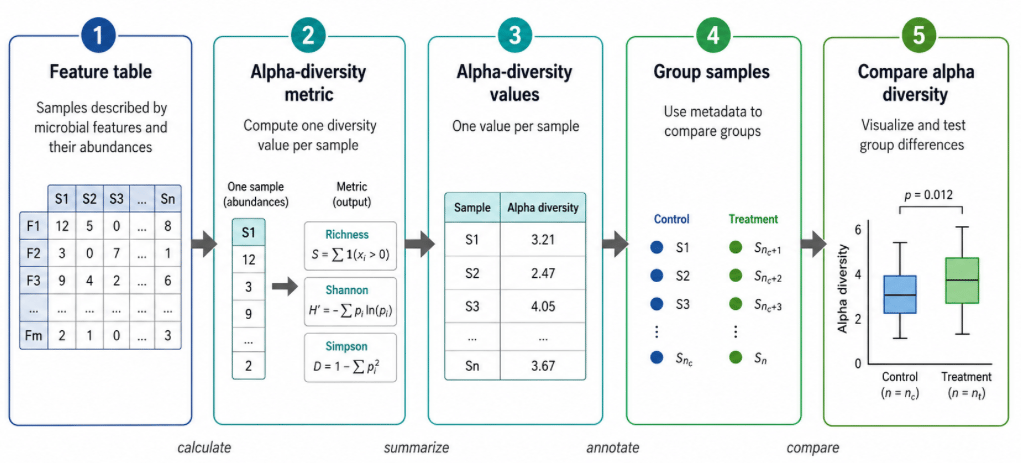
The input to alpha diversity analysis is a table of microbial features that describes the taxonomic or functional composition of each sample in your cohort.The value of a feature in a sample may be the number of sequencing reads assigned to a given taxon or function (counts), or a relative abundance.Each sample’s profile is therefore a vector of numbers, and alpha diversity indexes allow to reduce that profile to a single value.
2
Choose the question you want to answer
Alpha diversity measures fall mainly into two categories, depending on what they quantify:
- Feature richness is the number of different features, for example microbial species or genera, present in a sample. It does not take into account how abundant these features are or how evenly their abundances are distributed.
- Feature evenness describes how the relative abundances are distributed across the features present in a sample. High evenness means that the features are present in similar proportions, and low evenness means that a few features dominate the community. For example, two samples can both contain four species. If each species makes up 25% of the community, evenness is high. If one species makes up 85% and the other three 5% each, evenness is low, although richness is the same in both samples.
- How many microbial taxa or functions are present or detected in my community?
- Is my community dominated by a few abundant organisms, or are they spread evenly across many?
3
Pick an alpha diversity metric
Choose an alpha diversity metric based on your research question and on the aspect of diversity you want to measure. Cosmos-Hub 2.0 currently supports three alpha diversity metrics.
4
Calculate alpha-diversity for each sample in your cohort
The chosen metric is calculated separately for each sample, so the output is a table with one alpha diversity value per sample.For example, calculating Shannon diversity for 80 gut samples gives 80 Shannon values, one per sample.
5
Compare alpha-diversity across different groups
Once each sample has a diversity value, you can compare those values across groups defined by metadata, meaning descriptive variables such as treatment, disease status, body site, time point, cohort, sex, or age group.For example, in a treated-versus-control study, you might group samples by Treatment and ask whether one group tends to have higher or lower within-sample diversity than the other.
6
Visualize and test alpha-diversity patterns acrosss groups
Alpha diversity is usually displayed as a boxplot, with one point for each sample. This lets you see at a glance whether the groups differ in their typical value, in their spread or in the presence of outliers.When you read the plot, look at three aspects.
- Whether one group shows consistently higher or lower diversity than the others.
- Whether one group is much more variable than the others.
- Whether some samples are outliers, and whether they reflect a biological effect or a technical issue such as low sequencing depth.
A statistically significant difference in alpha diversity tells you that groups differ for the selected metric, but it does not tell you which taxa caused the difference. To identify the organisms or features might be driving a shift in alpha-diversity across groups, follow up with methods to identify differentially abundant features (such as the Univariate Comparison or ML Classification analysis modules)